Share article
Share article
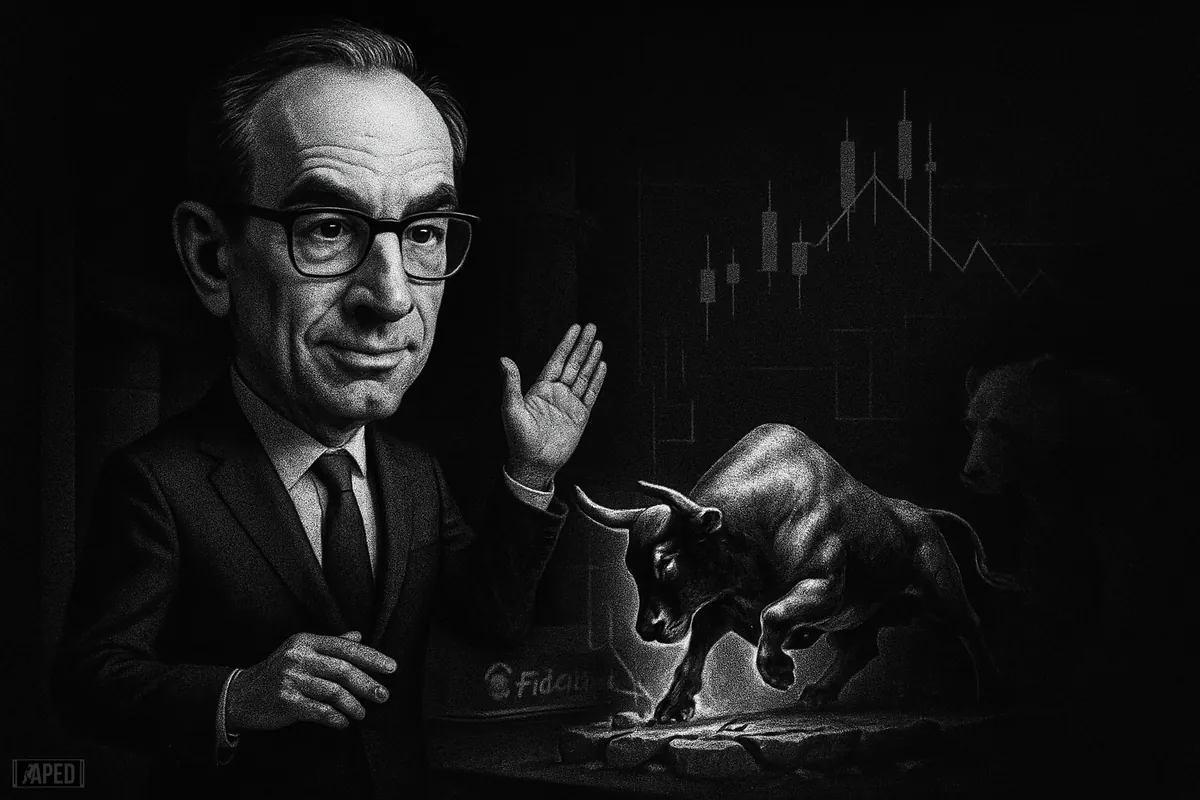
Bitcoin$62,936.00 just did the thing that usually gets bulls rekt, it hit a classic technical rejection zone while momentum gauges were already overheated. Instead of rolling over, it held near $79,500. That is the setup Fidelity's global macro director Jurrien Timmer says has flipped from bearish warning to bullish tell. [1]
Timmer's read is simple: when an asset refuses to drop on a setup that should knock it down, the market is probably stronger than it looks. For traders, the key level is not the oscillator itself. It is whether Bitcoin$62,936.00 can keep defending this breakout area while pressure builds at trendline resistance.
Enjoy articles without ads?
Register for free and get unlimited access to all articles.
Why the usual bearish signal failed
Under traditional chart logic, Bitcoin had wandered into what Timmer called a "kiss of death" zone. The mix was familiar: overbought stochastic readings and a test of major trendline resistance. In weaker market regimes, that combination often marks exhaustion, then a fast pullback. [2]
This time, the selloff never really showed up. Bitcoin stayed pinned around $79,486 instead of losing structure. That matters because technical indicators do not operate in a vacuum. A bearish setup that fails is often more informative than one that works. It suggests buyers are absorbing supply that would normally push price lower.
Timmer's bull market interpretation
Timmer has now shifted from a more cautious stance to what he describes as an emerging bull market scenario. The logic is regime-based. In bear markets, overbought conditions can act like a trap door. In bull markets, they can stay overbought for longer than skeptics expect, because momentum reflects persistent demand rather than late-cycle froth. [3]
That does not mean every hot reading is bullish. It means context matters. If Bitcoin$62,936.00 can sit at elevated momentum levels and refuse to break down, the market may be transitioning from rebound mode to trend mode.
What the signal means for traders
The practical takeaway is less mystical than the "kiss of death" label suggests. Traders are looking at whether resistance becomes support. If Bitcoin holds the high $79,000 zone and keeps invalidating bearish chart expectations, dip sellers can get squeezed into chasing higher.
That said, failed bearish signals are not a free pass. They become meaningful only if price confirms. A clean loss of the recent support area would weaken the whole thesis and put the market back into "dead cat or distribution" territory. Bulls still need follow-through, not just vibes.
Why this matters beyond one chart pattern
Fidelity's Timmer is not some random account posting rocket emojis between liquidation maps. He runs global macro at a firm managing roughly $7.1 trillion. That does not make him infallible, but it does mean his framing carries weight, especially with allocators who care more about regime shifts than intraday noise. [3]
His revised stance also fits a broader pattern seen across risk markets: strong assets often stop reacting bearishly to bad-looking setups before a larger uptrend becomes obvious. Price resilience tends to show up before consensus does.
The Bigger Picture
Bitcoin's latest message is blunt: if a textbook rejection cannot push it lower, the path of least resistance may be up. Timmer's call is essentially a market strength argument wrapped in technical language. Resistance, overbought readings, and caution were all on the table. Sellers still failed to land the hit. [4]
Watchlist from here: can BTC keep defending the upper $79,000 area, can momentum remain firm without a sharp reset, and does price finally break through trendline resistance with conviction. If yes, the "kiss of death" may end up looking less like a top signal and more like the market ringing the opening bell for the next leg.